Status Check & Heatmap
The status check and heatmap aren’t tools to pass judgment on you. They’re more like a dashboard: they turn your records into colors, stages, and prompts so you can quickly spot what’s worth a second look.
If you treat them as a score, it’s easy to feel anxious. But if you treat them as clues, they become genuinely useful. A darker color, a shift in stage, or an anomaly alert – each is just an invitation to take a closer look.
Three kinds of help
Section titled “Three kinds of help”| Information | What it tells you | How to use it | | --- | --- | --- | | Time investment stage | Which range your day’s focused time falls into | Use it to roughly gauge your rhythm | | Heatmap threshold | Which color corresponds to which time range | Adjust the color layers to your liking | | Anomaly detection | Unusual changes in your records | Investigate the cause, don’t treat it as a verdict |
Time investment stage
Section titled “Time investment stage”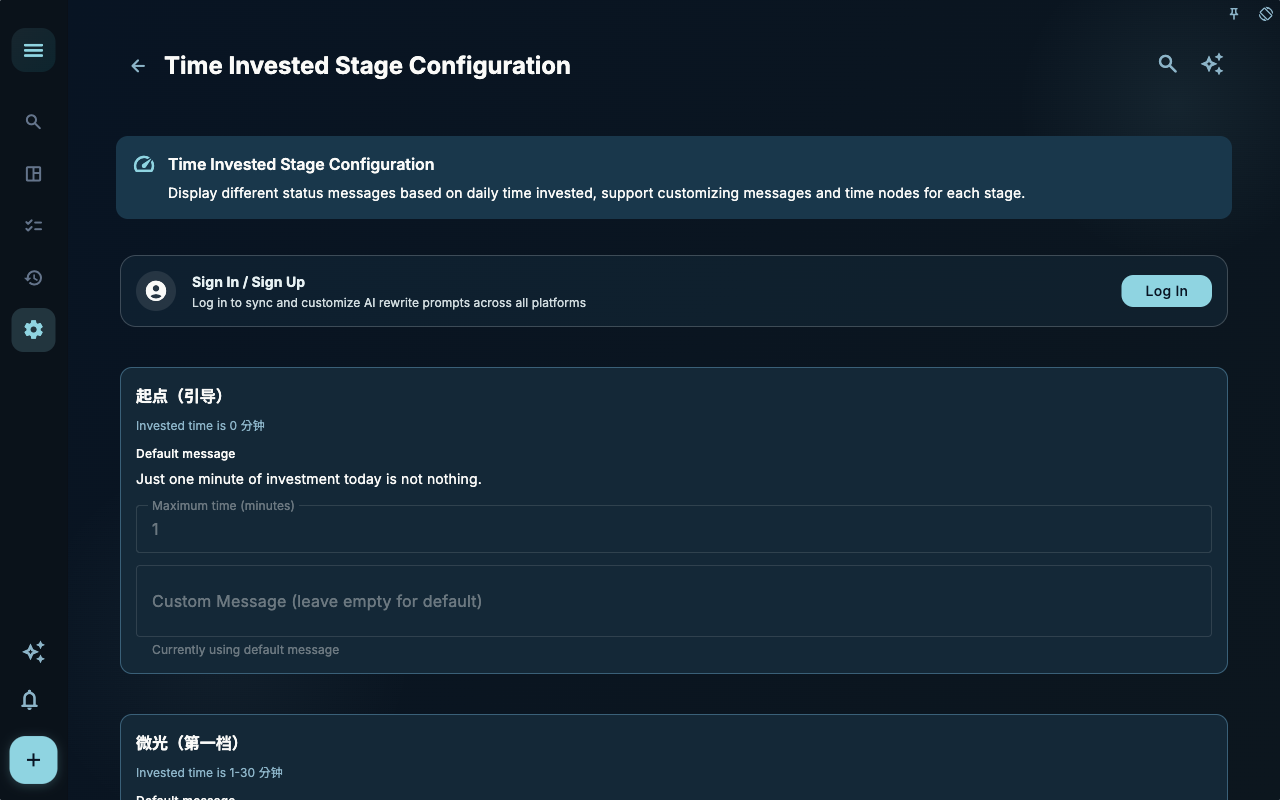
The status check settings let you customize the labels and ranges for time investment stages. For example, if you feel that 2 hours is a solid dedicated block, you can adjust the corresponding stage to better match your own rhythm.
This only changes how things are displayed during review; it doesn’t alter historic tasks or judge whether you “worked hard enough.”
Heatmap threshold
Section titled “Heatmap threshold”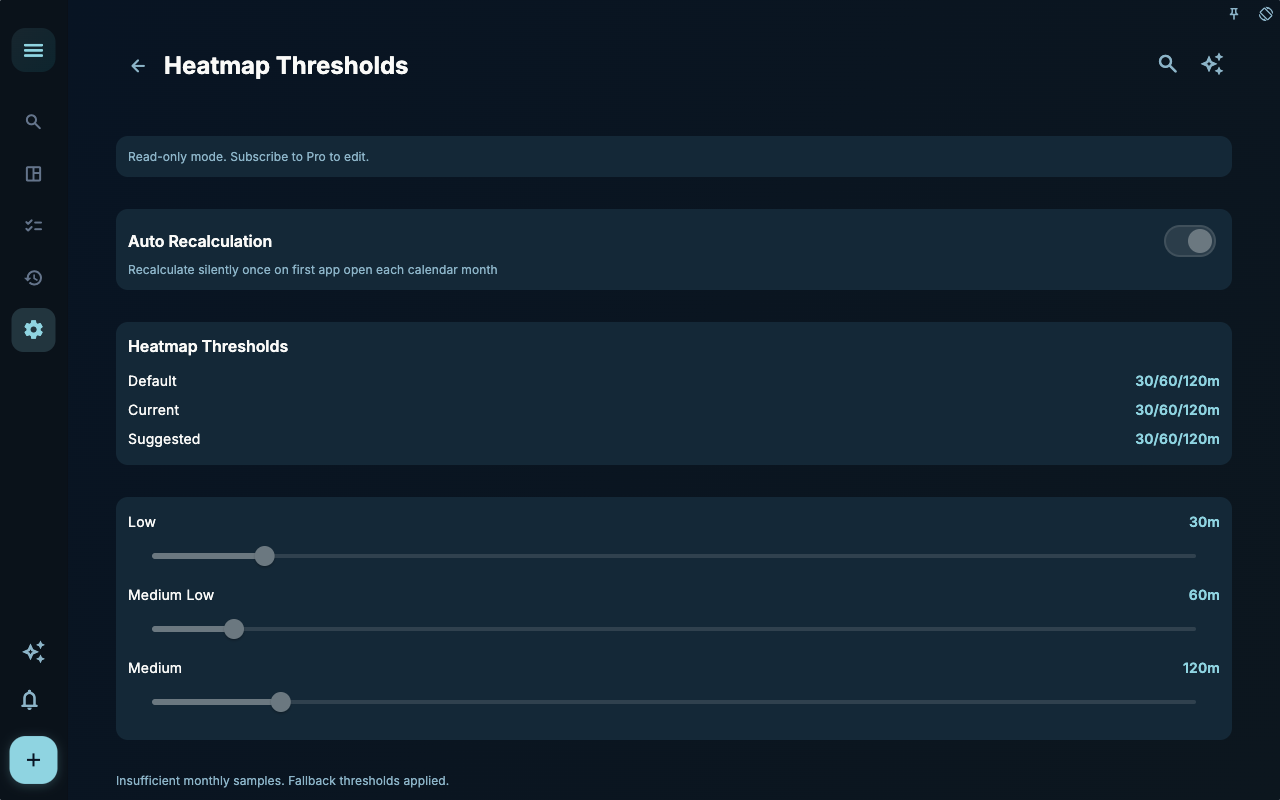
The heatmap uses color intensity to show how much time you invested each day. The threshold determines “how much time counts as light, medium, or dark.” If your daily work is naturally fragmented, you can set the thresholds lower; if you only want to highlight days with long focused periods, you can set them higher.
Anomaly detection
Section titled “Anomaly detection”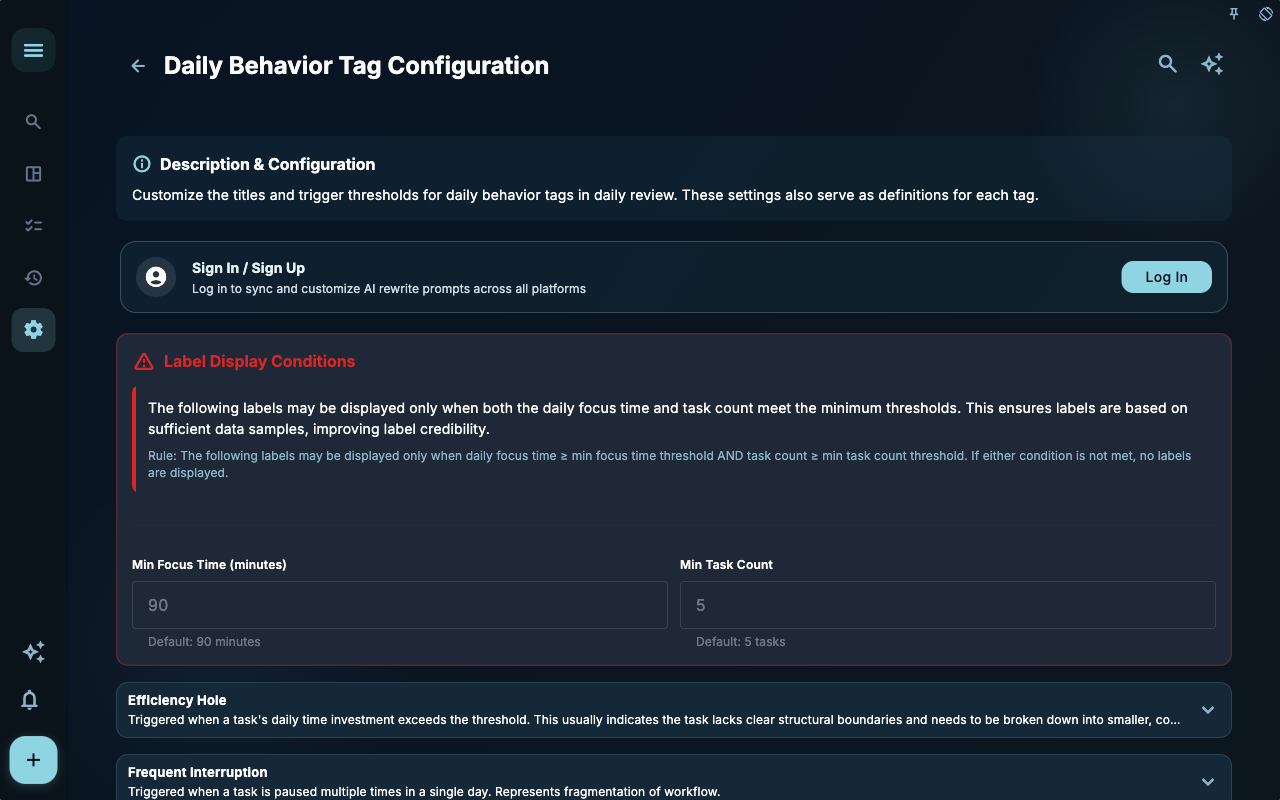
Anomaly detection alerts you when a record deviates noticeably from your norm. For instance, if a certain task type suddenly disappears, or if the time invested changes dramatically.
Such alerts aren’t automatically problems. They could be exam week, a business trip, a project switch, or simply that you’ve shifted your focus elsewhere. The real value lies in asking why – not in rushing to fix the numbers.
A real‑world scenario
Section titled “A real‑world scenario”You notice that the heatmap color for one week suddenly becomes much lighter. Your first reaction might be “this week wasn’t good enough.” A steadier approach is to go back to the tasks and projects: was this week mostly meetings, organizing materials, or waiting for feedback? Did some tasks get completed without their time being logged?
If records are missing, fill them in. If the change was in your schedule, write down the reason in your review. The value of status prompts is to help you turn vague feelings into concrete records.
Troubleshooting order
Section titled “Troubleshooting order”| Check first | What it may indicate | Next step | | --- | --- | --- | | Do tasks have time logged? | Time invested may be missing data | Go to task details and add start and finish times | | Was flow time entered manually? | Weekly/monthly flow stats may be empty | Enter it in the daily review or completed task details | | Are thresholds too high or too low? | Heatmap colors don’t feel right | Adjust thresholds and observe again | | Does the anomaly match reality? | It could just be a rhythm change | Note the reason in your records; don’t rush to change tasks |
Next steps
Section titled “Next steps”If you find the issue lies in a task’s time log, go back to the daily review and task details to correct the time records. If you want to turn these clues into text you can revisit later, continue reading Records & History.